The Transverse Offset Technique
Theory
When two single mode fibers are butted together to form a joint, the fundamental mode field of the source fiber is coupled into the modes of the recipient fiber. These recipient modes consist of the fundamental mode, lossy cladding modes and radiation modes. The magnitude of the source mode field coupled into each recipient mode is given by the overlap integral of the two modal electric fields. In the transverse offset technique, we are concerned with the transfer of optical power from the source mode into the same mode of an identical fiber when their axes are parallel but laterally offset from each other.
The power coupled from the fundamental mode of the source fiber into the same mode of an identical recipient fiber is given by the square of the field overlap integral, C(u) . With reference to Figure 10, the overlap integral can be expressed as:
where u = u is the magnitude of the separation of the fiber axes. The integral should be performed over the region S , which extends over all space.
The overlap integral can be expressed as a convolution in polar co-ordinates , such that:
Where
and the * represents a 2-dimensional convolution. The Hankel transform of the convolution is :
where F2( p) is the far-field power distribution of the fiber. Through equation 6-3, the measured power transfer function for the offset splice, C2 (u) , can be related to the near-field of the fundamental mode via the far field power distribution. The near-field distribution can then be used to calculate the effective area, as described in section 2.
Experimental Technique
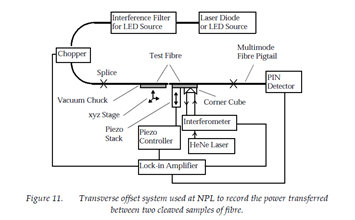
The transverse offset system developed at NPL is shown below in Figure 11. A sample of test fiber was cleaved and checked with an interferometer to ensure that the cleaved end faces were perpendicular to the fiber axis to within 0.5°. The fiber samples were then mounted in vacuum chucks facing each other and actively aligned using an xyz flexure stage to maximise the detected signal. The end faces were brought as close together as possible without making contact. The lateral offset between the fiber axes was then scanned using the piezo actuator attached to one of the vacuum chucks.
The position of the scanning fiber was monitored by measuring the output from an interferometer. Scanning was automated by using the lock-in amplifier to drive the piezo controller and read the output signals from the interferometer and the throughput power detector. The range of travel of the piezo stack was approximately 15-mm – meaning that at least two scans were required to cover enough range to measure a complete transmission curve.
An example of a power transmission curve starting from a point just to one side of the peak transmission is shown below in Figure 12.


