The Variable Aperture in the Far-Field (VAFF) Technique
Theory
The direct far-field scanning technique measures the angular distribution of the far-field intensity distribution from the single mode fiber, F( p)2 .The variable aperture technique also measures power in the far-field but rather than making a continuous measurement of the intensity distribution, the total power passing through a set of circular apertures is measured. It is assumed that the far-field and therefore the fiber are rotationally symmetric. The apertures are centred on the optical axis of the fiber so that they are also centred on the axis of rotational symmetry of the far-field pattern.
For a circular aperture of radius a located a distance D from the fiber endface, the half angle of the cone subtended by the aperture at the fiber endface, qaperture , is given by:
The optical power passing through the aperture from a curved wavefront centred on the fiber endface is given by [1]:
Equation 5-2 forms the basis for the EIA/TIA reference test method for mode-field diameter measurement by the VAFF technique [10]. However, it has been suggested that equation 5-2 is incorrect and that the appropriate version of equation 5-3 is [11]:
where R is the distance from the fiber endface to the edge of the aperture. This is the expression that has recently appeared in ITU-T draft recommendations for an effective area test method [12]. The difference between the two expressions can be understood from Figure 7, which shows the parameters used to derive equations 5-3 and 5-4. The discrepancy arises from which incremental length of the phase front is integrated to give the total power passing through the aperture. Equation 5-4 uses the arc length along the curved wavefront, given by Rdq’ . However, 5-3 uses the projection of this curved section onto a plane parallel to that of the aperture, Rdq’ cos(q’) . Clearly, for small angles cos(q’) » 1 and the difference between the two formulations is minimised. It has been shown that they lead to a difference in calculated MFD of typically less than 0.5% – even for dispersion shifted fibres with the smallest cores and broadest far-fields [11].
Once the aperture power function has been determined for a number of apertures, the relative far-field power distribution can be calculated from its gradient. Analysis of the data then follows the same method as that of the direct far-field method, i.e. transformation to the near-field and calculation of the effective area from the field distribution (see section 3). The far-field power distribution can be calculated using either
depending on whether the aperture power function is assumed to follow from equation 5-2 or 5-4 respectively.
Experimental Technique
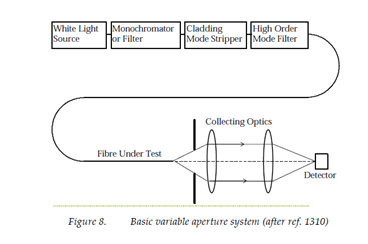
The basic experimental setup for the variable aperture technique is shown below in Figure 8. Apertures of different diameters are usually precision mounted on a wheel so that they can be easily changed and the throughput power measured for each one. Figure 9 shows an example of measured VAFF data for a matched-cladding fiber.
The equipment used in our investigations was a PK Technology S25 measurement system including an internal tungsten halogen lamp filtered using a monochromator with 10-nm spectral width. The wavelength calibration uncertainty is estimated to be less than ±2-nm. Twenty three apertures were used, giving a range of collection numerical apertures (= sin(qaperture )) from 0.0066 to 0.4948.


